How Much Electricity Can Solar Panels Generate in the UK?
A well-sited 4kWp solar panel system in the UK typically generates around 3,400 to 3,800kWh of electricity a year. As a rule of thumb, each kilowatt peak (kWp) of panels produces roughly 800 to 950kWh annually, depending on where you live, which way the roof faces and how much shade it gets. This guide explains what those figures mean, how much a typical home can expect by system size, region and month, and how to check whether an installer's generation forecast is realistic for your roof. ## How much electricity does a solar panel system generate a year? For an unshaded, south-facing roof in most of England and Wales, a fair planning figure is 850 to 950kWh for every kWp installed. The table applies that range to common domestic system sizes.System size
Approx. panels (430W)
Annual generation
Average per day
3kWp
7
2,550-2,850kWh
7-8kWh
4kWp
9-10
3,400-3,800kWh
9-10kWh
4.5kWp
10-11
3,800-4,300kWh
10.5-12kWh
5kWp
11-12
4,250-4,750kWh
11.5-13kWh
6kWp
14
5,100-5,700kWh
14-15.5kWh
7kWp
16
5,950-6,650kWh
16-18kWh
*These are illustrative ranges for a well-sited roof, not a forecast for your home. East- or west-facing roofs, homes in northern England or Scotland and partly shaded arrays will normally sit below them.* ### Why government figures look lower The official figure covers hundreds of thousands of older installations, including panels on poorly-oriented or shaded roofs and systems that have aged for over a decade. DESNZ noted that 2024/25 had the fewest sunshine hours since 2012/13. A new, well-designed system on a good roof should normally beat the national median, but the data is a useful reality check if a quote looks optimistic. ## What the numbers mean (kW, kWp and kWh) Solar quotes mix three units, and confusing them is the most common reason people misread a generation estimate.  - **kWp (kilowatt peak)** is the system's rated size. It is the combined output of the panels under standard laboratory test conditions: bright light of 1,000 watts per square metre at a cell temperature of 25°C. Ten 400W panels make a 4kWp array. - **kW (kilowatt)** is the power the system is producing at a given moment. A 4kWp array on a UK roof rarely produces a full 4kW, even at noon in June, because real conditions are rarely as intense as the test. - **kWh (kilowatt hour)** is the amount of energy produced over time. It is the unit on your electricity bill, so it is the figure that matters for savings. A useful way to picture it: kWp is the size of the engine, kW is how hard it is running right now, and kWh is the distance travelled. Two 4kWp systems can produce very different kWh totals if one sits on a shaded east-facing roof in Aberdeen and the other on an open south-facing roof in Cornwall. The panels produce direct current, and an inverter converts it to the alternating current your home uses, losing a small amount of energy along the way. Our guide to [ how solar panels work ](https://gosolartoday.co.uk/articles/how-do-solar-panels-work) explains each step of that process. ## Does it matter where in the UK you live? Yes, but less than many people expect. Southern England receives the most sunlight over a year, so an identical system in Devon will usually out-produce one in Inverness. The gap between a good roof in Scotland and an average roof in the south can be smaller than the gap caused by poor orientation or shading.Area
Indicative output, south-facing roof at 30-40°
4kWp system, per year
South West England
950-1,050kWh per kWp
3,800-4,200kWh
South East England and London
900-1,000kWh per kWp
3,600-4,000kWh
East of England
900-1,000kWh per kWp
3,600-4,000kWh
Midlands and Wales
850-950kWh per kWp
3,400-3,800kWh
Northern England
800-900kWh per kWp
3,200-3,600kWh
Northern Ireland
750-850kWh per kWp
3,000-3,400kWh
Scotland
700-850kWh per kWp
2,800-3,400kWh
These are indicative planning ranges for an unshaded roof, not official figures. Your installer should calculate output for your exact postcode using the MCS method explained below. ### What the government data shows DESNZ's [ Feed-in Tariff load factor analysis 2024/25 ](https://assets.publishing.service.gov.uk/media/69403c4a33c7ace9c4a4220b/Feed-in_Tariff_load_factor_analysis_2024-25.pdf) found that South West England, the East of England and North East England had the highest median solar load factors, all at around 9.5%. London had the lowest, followed by Scotland and North West England. DESNZ suggests London's result may be down to shading from tall buildings or pollution settling on panels, which shows that local conditions can outweigh latitude. 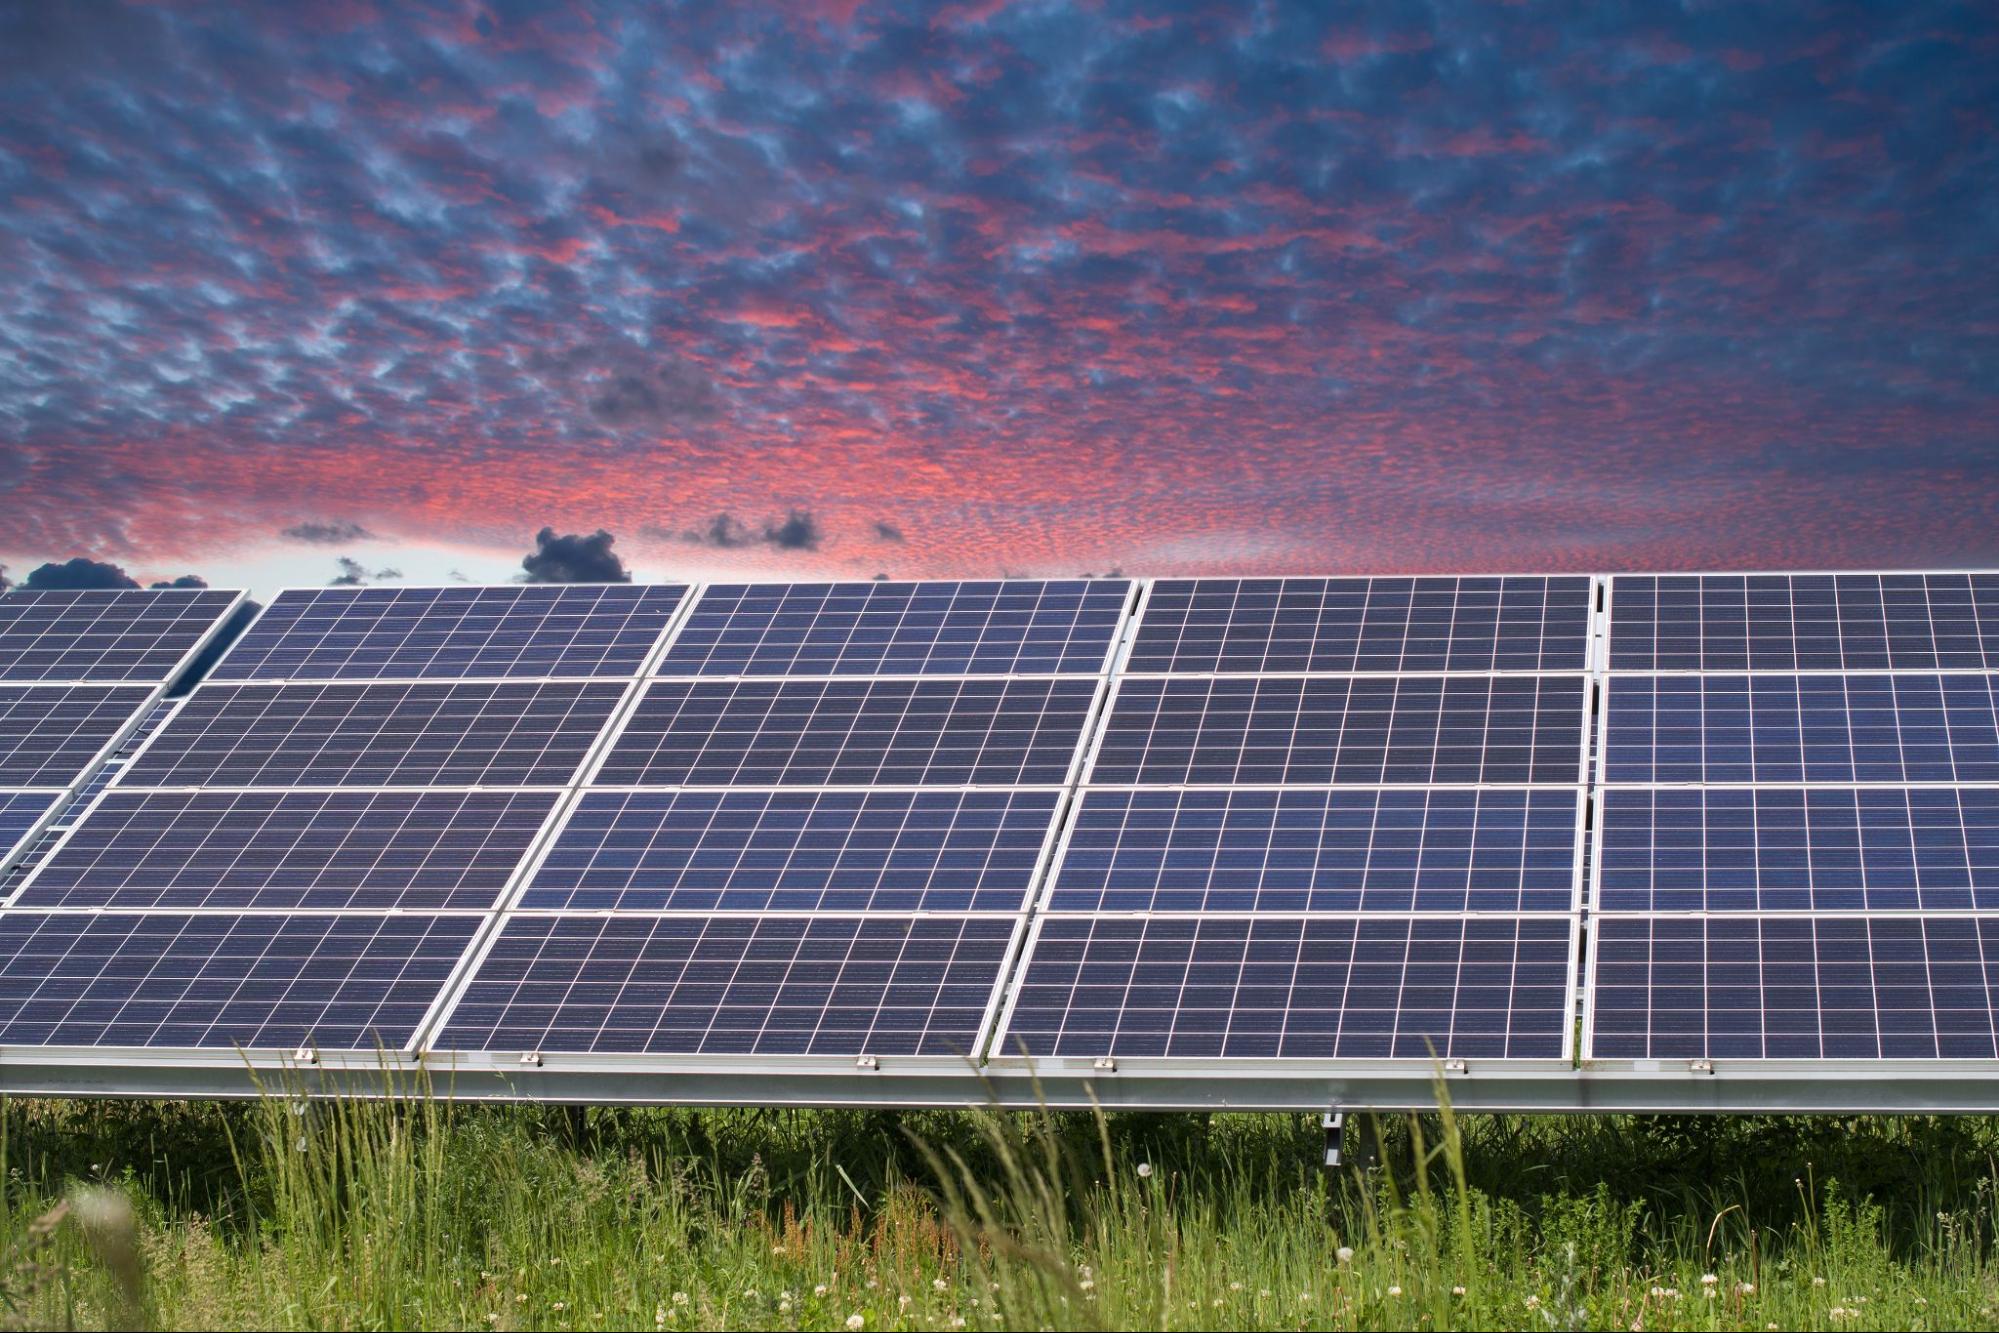 The department's [ Regional renewable electricity in 2025 ](https://assets.publishing.service.gov.uk/media/6aba64348cb3c0580e501273/Regional_renewable_electricity_in_2025.pdf) report adds a useful twist. In 2025, the sunniest year in its records, solar load factors were almost identical in England (11.2%), Wales (11.2%) and Scotland (11.1%), with Northern Ireland at 9.4%. Year-to-year weather can move output as much as location does. If you live in Scotland or the north of England, solar can still make financial sense. Lower output lengthens the [ solar panel payback period ](https://gosolartoday.co.uk/articles/solar-panel-payback-period) rather than ruling solar out: the [ Energy Saving Trust ](https://energysavingtrust.org.uk/advice/solar-panels/) estimates payback with export payments at around 9 years in London, 10-11 years in Manchester and 11-12 years in Stirling. ## How much do solar panels generate each month? Around 70% of a UK system's annual output arrives between April and September. June is usually the strongest month and December the weakest, with the best month producing five or six times as much as the worst. The table shows how 3,600kWh a year, a realistic total for a well-sited 4kWp system, might be spread across the months.Month
Illustrative generation
Average per day
January
108kWh
3.5kWh
February
180kWh
6.4kWh
March
306kWh
9.9kWh
April
396kWh
13.2kWh
May
468kWh
15.1kWh
June
504kWh
16.8kWh
July
468kWh
15.1kWh
August
414kWh
13.4kWh
September
324kWh
10.8kWh
October
216kWh
7.0kWh
November
126kWh
4.2kWh
December
90kWh
2.9kWh
Total
3,600kWh
9.9kWh
*This is an illustrative seasonal profile for southern and central England, not a forecast. Any single month can be well above or below it depending on the weather, and the profile is more pronounced further north, where winter days are shorter.* ### Do solar panels work in winter? Yes. Panels respond to daylight rather than heat, so they keep generating on cold, bright days and, at a lower level, on cloudy ones. Cold conditions actually help: silicon panels become less efficient as they heat up, so a clear, frosty morning can produce strong output for the light available.  The limits in winter are short days, a low sun that passes through more atmosphere and is more easily blocked by trees or buildings, and snow cover. A light dusting usually slides off a pitched roof within a day or two. Never climb onto a roof to clear panels yourself. Because winter generation is low, most homes will still import a large share of their electricity between November and February. Solar panels [ reduce your electricity bill ](https://gosolartoday.co.uk/articles/can-solar-panels-reduce-electricity-bill) all year round, but the biggest cuts come between April and September. ## What affects how much electricity your panels produce? System size and location set the starting point. The design of the installation and the condition of the roof decide how close you get to it. ### Roof direction South-facing roofs produce the most over a year. The Energy Saving Trust says a system facing east or west tends to receive around 15-20% less energy than one facing directly south, and it does not recommend north-facing roofs. East-west systems are not a poor choice. They spread generation across the morning and evening, which can suit a household that uses more electricity at the start and end of the day. Many homes split panels across both roof faces for that reason. ### Roof pitch In the UK, a pitch of around 30-40° captures the most sunlight across the year, and most pitched roofs fall close to that range. Flatter roofs gather slightly less in winter and slightly more in summer. Panels on flat roofs are normally tilted on frames, and the Energy Saving Trust notes that rain keeps panels reasonably clean when they are tilted at 15° or more. ### Shading Shade is often the biggest single cause of a disappointing system. Chimneys, dormers, trees, satellite dishes and neighbouring buildings can all cast shadows, and the low winter sun makes long shadows worse. On a standard string inverter, shade on one panel can reduce the output of others connected to it. Panel-level optimisers or microinverters limit that effect. They add cost and only help if there is real shading to manage. ### Temperature Solar panels prefer bright, cool weather. The Government Office for Science roundtable noted that silicon panel efficiency drops once air temperatures exceed 23°C. That is why a clear day in April can rival a hot day in July. ### Panel efficiency and wattage Higher-efficiency panels fit more kWp into the same roof area. They do not make each kWp produce more kWh. If roof space is limited, efficiency matters; if it is not, a standard panel at a lower price may give a better return. ### Inverter and system losses Energy is lost in cabling, in the inverter and through dust and dirt. A well-designed modern system typically loses around 10-15% of the panels' raw output between the roof and your sockets. The Energy Saving Trust advises that an inverter may need replacing after around 12 years, while the panels should last 25 years or more. ### Age of the panels Panels slowly lose output over time. Most manufacturers warrant that panels will still deliver around 80-90% of their original output after 25-30 years, which works out at roughly 0.4-0.5% a year. Build that gradual decline into any long-term savings forecast. ## How to estimate your own system's generation MCS-certified installers estimate annual generation with a standard formula set out under the MCS solar PV standard, [ MIS 3002 ](https://mcscertified.com/wp-content/uploads/2025/01/MIS-3002-2025-V1.0.pdf) : Estimated annual output (kWh) = system size (kWp) × Kk × shade factor - Kk is the expected kWh per kWp for your postcode zone, roof direction and pitch, taken from MCS data tables. - The shade factor runs from 1.0 (no shading) downwards. A shade factor of 0.85 means shading is expected to cut output by 15%. For example, a 4kWp system on a south-facing roof with a Kk of 950 and a shade factor of 0.95 would be estimated at 4 × 950 × 0.95 = 3,610kWh a year. You can sense-check a quote in three ways: 1. Use the [ Energy Saving Trust solar calculator ](https://energysavingtrust.org.uk/tool/solar-energy-calculator/) for an independent estimate based on your home and roof. 2. Try the European Commission's free [ PVGIS tool ](https://re.jrc.ec.europa.eu/pvg_tools/en/) , which models output for any location using satellite weather data and shows a month-by-month breakdown. 3. Divide the installer's annual estimate by the system size. If the answer is well above 1,000kWh per kWp, ask how it was calculated, particularly if you live outside the south of England or have any shading. ### What a good quote should show An installer's generation estimate should state the system size, roof direction and pitch for each array, the Kk value used, the shade factor and the resulting annual kWh. If a quote gives a savings figure without the generation figure behind it, ask for it.  The [ MCS installer search ](https://mcscertified.com/find-an-installer/) lets you confirm that a company is certified. MCS certification is also normally required to receive Smart Export Guarantee payments. Compare each generation forecast alongside the price, because [ solar panel costs ](https://gosolartoday.co.uk/articles/how-much-do-solar-panels-cost) vary widely with system size, roof type and equipment. ### After installation Most inverters come with an app or online portal. Check it monthly in the first year and compare it with your installer's forecast, allowing for weather. A system that falls well short in a sunny spring or summer month may have a fault, a shading issue or a configuration problem worth raising with the installer. ## So, how much electricity can solar panels generate in the UK? For most well-sited homes, expect around 850 to 950kWh a year for every kWp installed, or about 3,400 to 3,800kWh from a typical 4kWp system. Southern England sits towards the top of that range and Scotland towards the bottom, while roof direction and shading can matter as much as location. The most reliable figure is one calculated for your roof. Get a free solar estimate with the [ Go Solar Today savings calculator ](https://gosolartoday.co.uk/) , then compare quotes from up to four vetted, MCS-certified installers covering your postcode. Each should show its generation forecast and the assumptions behind it.